Explore our flood risk map and find your flood risk
Our maps provide flood risk information and flood protection intervention in an easy to use format.
We believe in simplicity and reliability. We have created this page to give you the flood risk information in a reliable format.
Water Experts committed to protect your livelihoods. Joint the success of our clients!
Our Services
Explore Urban flood risk
4,996 properties at high or medium risk of flooding
15,861 properties at high or medium risk of flooding
12,589 properties at high or medium risk of flooding
12,233 properties at high or medium risk of flooding
58,1994 properties at high or medium risk of flooding
25,219 properties at high or medium risk of flooding
610 properties at high or medium risk of flooding
76,333 properties at high or medium risk of flooding
10,506 properties at high or medium risk of flooding
1,890 properties at high or medium risk of flooding
3,236 properties at high or medium risk of flooding
24,432 properties at high or medium risk of flooding
1,258 properties at high or medium risk of flooding
10,506 properties at high or medium risk of flooding
2,347 properties at high or medium risk of flooding
25,535 properties at high or medium risk of flooding
1,394 properties at high or medium risk of flooding
7,678 properties at high or medium risk of flooding
Frequently Asked Questions
What is an Environment Agency flood risk map?
The Environment Agency flood risk maps are created to assess the likelihood of flooding in specific UK areas. This map includes flood from rivers and sea for planning purposes, surface water run-off maps and reservoir maps. For instance, the Flood Map for Planning (Rivers and Sea) includes several layers covering Flood Zone 2 and 3. It evaluates the risk of flooding by ignoring the presence of flood defenses. The flood risk maps are produced to support the flood risk assessments in line with Planning Practice Guidance. The Environment Agency flood risk maps also help people living in flood areas understand flooding and make them aware of the hazards. The Environment Agency flood risk maps area based on modelled data with substantial assumptions being made. Therefore, this information should be taken as indicative and not used for specific sites or individual properties. This is because the Environment Agency does not have the final floor levels of your property.
What is flood risk mapping?
Flood Risk Mapping identifies areas that are at significant risk of flooding. The Environment Agency has completed this identification. It includes databases such as the main rivers and sea and the lead local flood authorities in charge of surface water flooding. In general, flood risk areas are determined where Flood Hazard and Risk Maps and Flood Risk Management Plans must subsequently be produced to meet national guidelines. You can explore the more relevant maps on our website.
How to evaluate flood risk maps?
Evaluating flood maps to identify the risk of flooding to an individual property is not feasible. This is because it is used at the regional or local level and does not contain the final floor level of the property. To understand the flood maps, it is necessary to look at the Flooding from Surface Water (RoFSW) and the flood risk from Rivers and Sea for planning, the risk of flooding from other sources, the groundwater flooding (not included by the Environment Agency) and the risk from sewer or location in critical drainage areas. Once you have the information, you can see the property and compare it with the risk of flooding. It is recommended that the assessment is carried out by a competent person who can determine the level of your property and obtain the flood levels from the Environment Agency.
How does flooding occur?
Flooding is part of a natural process within the water cycle, it starts when the atmosphere takes up and moves humidity over sea and land. It forms large and intensive rain zones.
Rainwater is retained in the vegetation cover (interception) before it reaches the soil and the groundwater. Water that does not infiltrate creates surface water run-of which is collected in streams and rivers. Once river banks overtops by the increasing discharge and water levels the flood waters spread over the floodplain.
Flood risk maps allow to determine the distribution of surface water run-off over the surfaces and its impact on the occupiers of the flood zones.
What are the type of floods?
Floods can be flash floods occurring locally after heavy precipitation, riparian floods regularly occurring along an entire river continuum, and coastal floods often combined with storm surges and typical for narrow coastal zones or extending into estuaries.
Flooding occurs at frequent intervals with probabilities of once in a year to once in 100 years or at even rarer intervals (e.g., once in 500 or 1000 years).
The inundation time and duration depends on the hydrological regime and the size of the catchment.
How can you use flood risk maps?
The Flood Risk Maps were initially produced to inform the Lead Local Flood Authorities in creating Flood Risk Management Plans for each catchment. The maps are currently also used for evaluating flood risk in areas and to provide awareness of flood risks that affect planning applications and development areas.
How do you check if a property is in a flood-risk area?
By typing your postcode into our database, you can check if your property is in a flood-risk area. To be outside of flood risk, your property should be located within flood zone 1, be at a very low risk of surface water flooding, and not within a flood warning area or the historic flood map areas.
Is it hard to sell a house in a flood zone?
It depends on the potential impact of the flooding and the flood risk. For instance, if your property is in areas of high flood risk, the impact (depth of water) is very low. There are interventions that you can undertake to protect your property. In most cases, it is necessary that you a flood risk assessment to be able to demonstrate these risks and the impact of flooding. It has been found that property prices dropped after major flooding; however, house prices recovered rapidly.
How do I find flood zones on Google Maps?
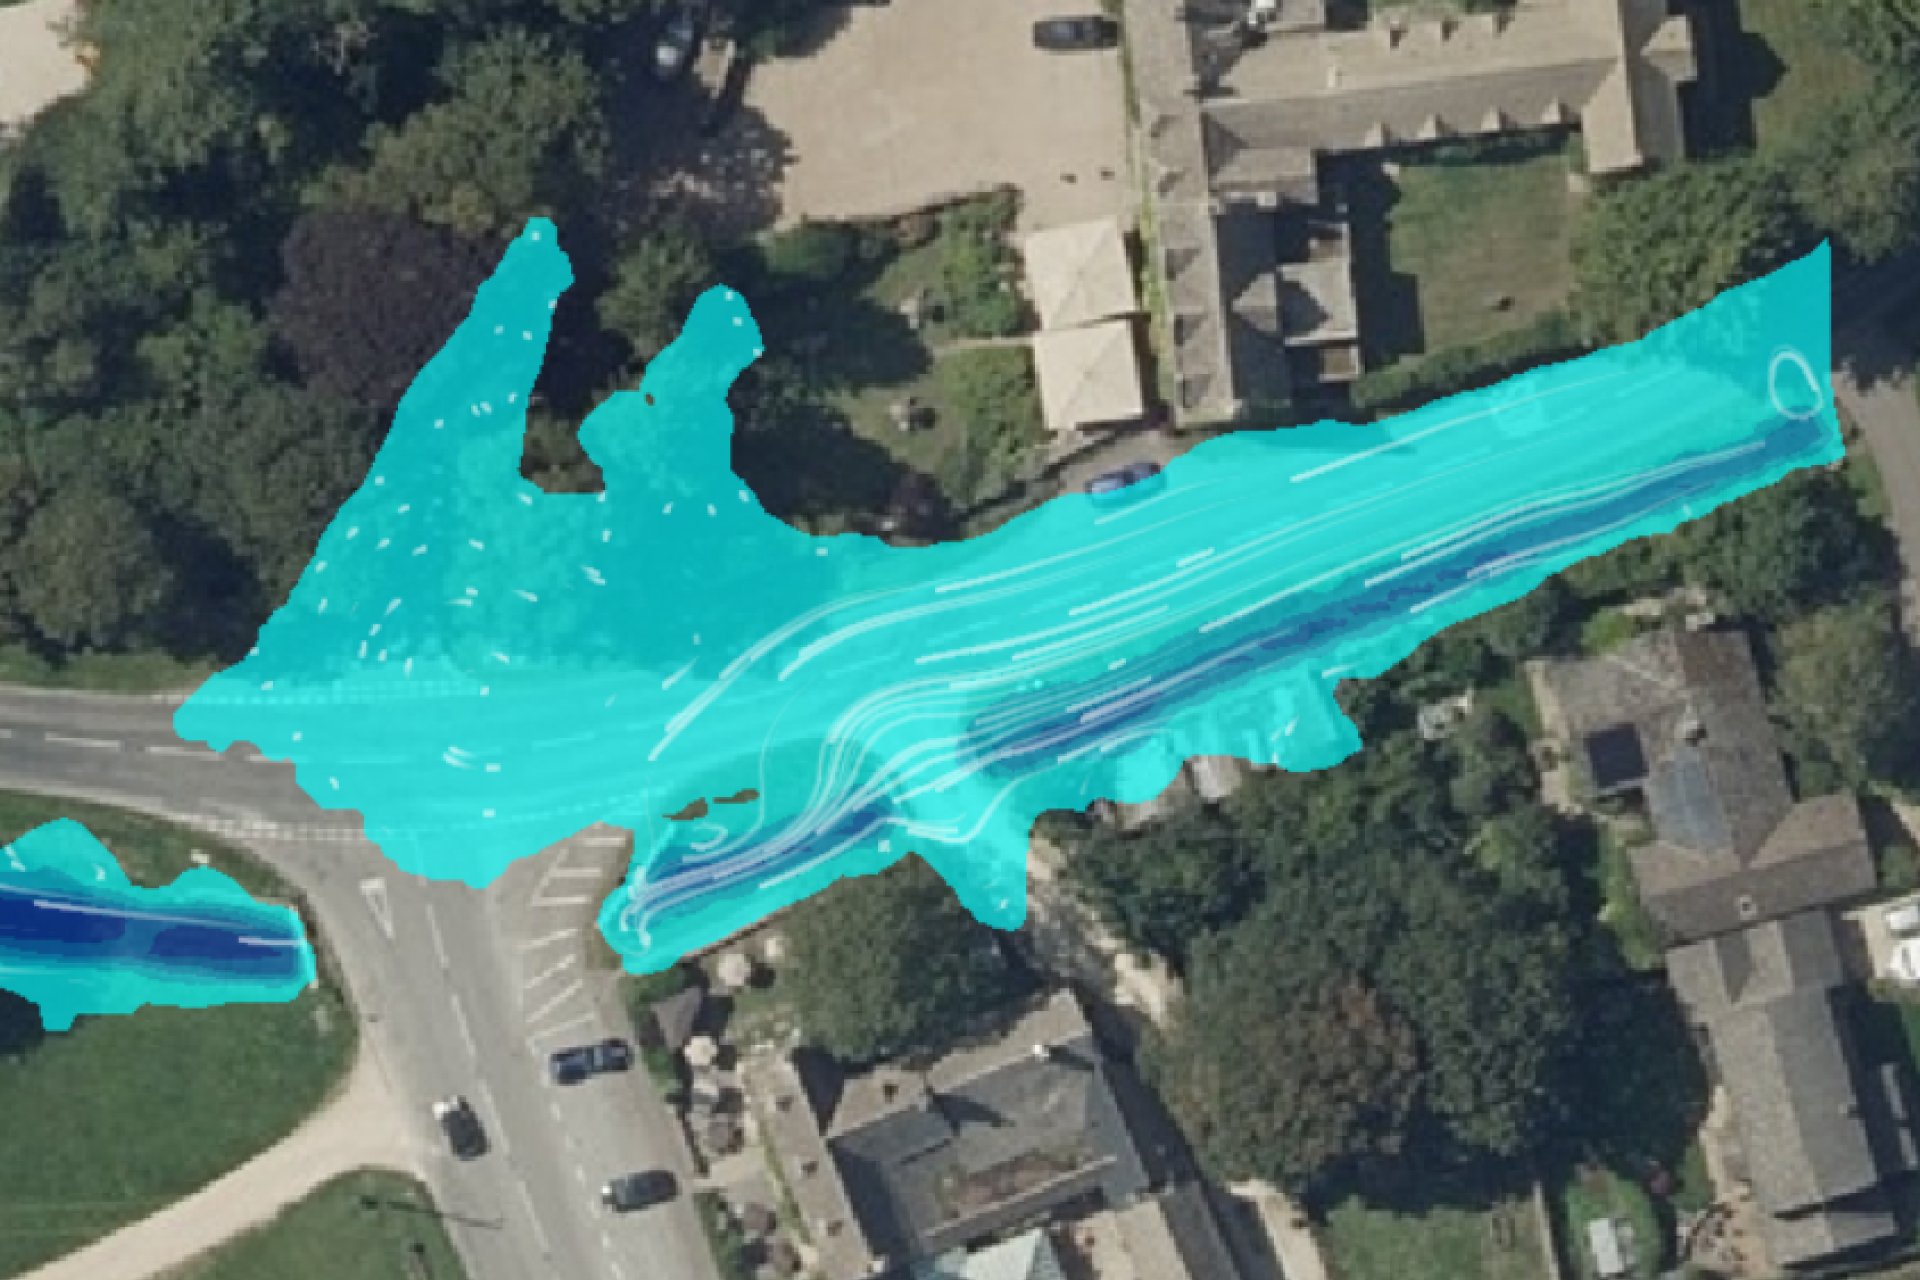
We have created maps that show the latest imagery, like google maps. You can see the most representative and up-to-date flood risk information.
Am I at risk of flooding?
You can explore the flood risk from surface water, rivers and sea, and reservoirs and also find out if your site can benefit from flood defenses, is in a flood warning area or has been a flood in the past. We also give you tips to start protecting your livelihood from flooding. Check out our flood risk maps above.
